
- 2026-06-11: Fixed the disclaimer - the default Capture Mode on 2016/2017 is ALL, not Auto (I had it backwards). Added version-specific notes for
MAX_STORAGE_SIZE_MBand SQL Server 2022 defaults. Thanks to @deweter in the comments for the correction - 2026-06-11: Updated
docs.microsoft.comlinks tolearn.microsoft.com
Foreword
Before you start tweaking Query Store settings, it helps to know what the defaults actually are. Not the documentation defaults, but what SQL Server actually sets. Turns out those two things don't always match.
Turn on the Query Store and check the settings
Let's create a new database and enable the Query Store.
ALTER DATABASE step. On 2019 and earlier, you need to turn it on manually.
USE master
CREATE DATABASE QS_Test /* Create a new DB */
GO
ALTER DATABASE QS_Test /* Enable the QS */
SET QUERY_STORE = ON (OPERATION_MODE = READ_WRITE)
The documentation says we should be getting these values:
| Configuration | Default |
|---|---|
| MAX_STORAGE_SIZE_MB | 100 (2017) / 1000 (2019+) |
| INTERVAL_LENGTH_MINUTES | 60 |
| STALE_QUERY_THRESHOLD_DAYS | 30 |
| SIZE_BASED_CLEANUP_MODE | AUTO |
| QUERY_CAPTURE_MODE | AUTO |
| DATA_FLUSH_INTERVAL_SECONDS | 900 |
We can check it with this query:
USE QS_Test /* Change context to our DB */

SELECT
    max_storage_size_mb,
    interval_length_minutes,
    stale_query_threshold_days,
    size_based_cleanup_mode_desc,
    query_capture_mode_desc,
    flush_interval_seconds
FROM sys.database_query_store_options
The first value (max_storage_size_mb) doesn't match up. On SQL Server 2019+, the actual default is 1000 MB (on 2017 it was 100 MB). The documentation has since been updated to reflect this, but at the time of writing it still said 100.

Also what exactly is the value AUTO for query_capture_mode and size_based_cleanup_mode?
QUERY_CAPTURE_MODE
There are 4 options for the Query_Capture_Mode (described in detail here):
- None
- All
- Custom
- Auto
The first two are pretty self-explanatory.
The Custom is the one that's interesting. It has four parameters defining the policy.
The Custom policy has two parts: a time window and three conditions. STALE_CAPTURE_POLICY_THRESHOLD (default 1 day) defines the evaluation period - think of it as "the time limit". During that window, at least one of these three must be true for the query to get saved:
EXECUTION_COUNT(default 30)TOTAL_COMPILE_CPU_TIME_MS(default 1000)TOTAL_EXECUTION_CPU_TIME_MS(default 100)
If we take the Custom policy defaults, our query has to:
Execute 30 times
ORtotal compile CPU time needs to be > 1s
ORtotal execution CPU time needs to be > 100ms
all during 24 hours.
Capture Mode: Auto
Does that mean that the Auto is the same as the Custom defaults?
To dig into that, we'll have to use Extended Events. More specifically the
query_store_db_settings_and_state event. If XE sessions are new to you, I covered setting one up in this post. A minimalistic session without a target (Watch Live Data) will do.
CREATE EVENT SESSION [QS_Settings] ON SERVER
ADD EVENT qds.query_store_db_settings_and_state
GO
It runs pretty infrequently (even tens of minutes on my machine) and creates a Query Store settings snapshot for each non-system database.
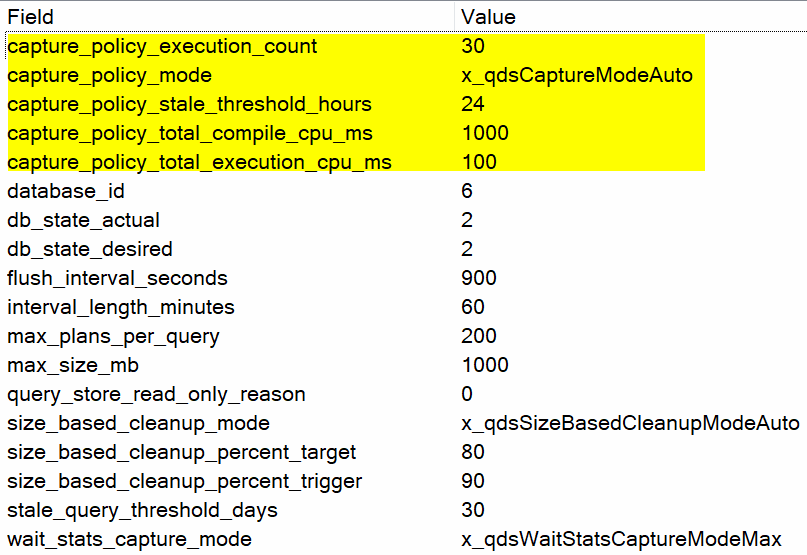
We can see that this time the values match the default of the Custom execution policy.
We found two surprises: max_storage_size_mb is 1000 on 2019+ (it was 100 on 2017, and the documentation at the time hadn't caught up). And Auto capture mode turns out to be just Custom mode with default thresholds. Armed with that, you can make informed decisions before you start tweaking.
One more thing to keep in mind if you're on SQL Server 2022: Query Store is now enabled by default on every new database. That's great for most workloads, but as @deweter pointed out in the comments - be cautious with systems that have heavy ad-hoc transactional workloads. Even with Auto/Custom capture policy, QS overhead can be noticeable on those systems.
Thank you for reading