
- 2022-07-23: Added the Actual execution plan section thanks to feedback by
 Paul White (SQL Kiwi)
Foreword
A Scalar function that hands back its input untouched does no real work, yet it still drags a query to over 20 times slower. Part One showed how UDFs quietly kill parallelism. This time we put numbers on the damage.
If you want to follow along, start with the code from Part One.
TSQL_SCALAR_UDF_INLINING = OFF). On SQL Server 2019+ (compatibility level 150) the optimizer can inline some functions and erase much of this overhead. I cover inlining, and when it kicks in, later in the series.
Set up monitoring
To gather the performance metrics, we'll set up additional monitoring tools. Namely:
- Query Store (QS)
- Extended Events (XE)
SET STATISTICS IO, TIME ON- Plan Explorer
If you don't have Plan Explorer, I highly recommend it.
To start, let's enable the QS first.
ALTER DATABASE [ScalarFunction]
SET QUERY_STORE = ON (QUERY_CAPTURE_MODE = ALL)
If you need to clear the QS between the runs, use this command.
ALTER DATABASE [ScalarFunction] SET QUERY_STORE CLEAR
Next, we'll set up the Extended Event session.
CREATE EVENT SESSION ScalarPerformance ON SERVER
ADD EVENT sqlserver.module_end
(
    SET
        collect_statement = 1
    ACTION
    (
        sqlserver.session_id
    )
    WHERE
        sqlserver.client_app_name = N'MonitorXE'
        AND object_type = 'FN'
)
, ADD EVENT sqlserver.sql_statement_completed
(
    ACTION
    (
        sqlserver.query_hash_signed
        , sqlserver.session_id
    )
    WHERE
        sqlserver.client_app_name = N'MonitorXE'
        AND sqlserver.query_hash_signed <> 0
)
This will only track events from a client application name that equals MonitorXE.
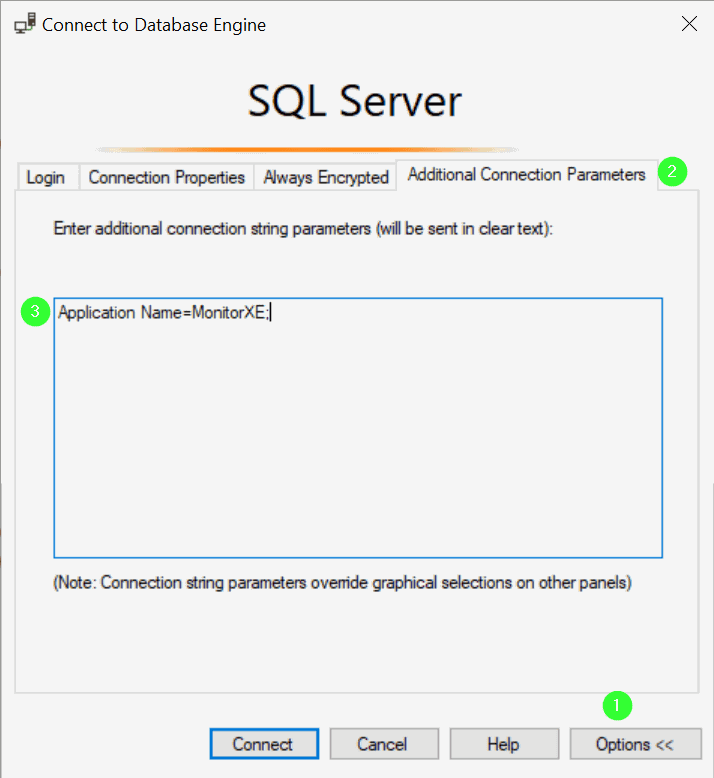
To do that, I will open a new SSMS connection and add this text to the Options\Additional Connection Parameters tab.
Application Name=MonitorXE;
Like so:
You can check that it worked with this snippet: SELECT APP_NAME() AS AppName.
Performance tests
I'll cover several test scenarios and analyze the performance using different monitoring tools.
The results will be for the second executions of the queries, so we have compiled and cached plans and all pages in the buffer pool.
DoNothing in a Select statement
Queries under test
SELECT TOP (10000)
    n.Id
FROM dbo.Nums AS n
ORDER BY n.Id
GO
SELECT TOP (10000)
    dbo.DoNothing(n.Id) AS Id
FROM dbo.Nums AS n
ORDER BY n.Id
Query Store
Get the performance data with this query.
SELECT
    CAST(qsq.query_hash AS bigint) AS query_hash_signed
    , LEFT(qsqt.query_sql_text, 100) AS textSample
    , qsrs.last_duration
    , qsrs.last_cpu_time
    , qsrs.last_logical_io_reads
    , qsrs.last_rowcount
    , qsrs.count_executions
FROM sys.query_store_query AS qsq
JOIN sys.query_store_query_text AS qsqt
    ON qsqt.query_text_id = qsq.query_text_id
JOIN sys.query_store_plan AS qsp
    ON qsp.query_id = qsq.query_id
JOIN sys.query_store_runtime_stats AS qsrs
    ON qsrs.plan_id = qsp.plan_id
Where qsqt.query_sql_text LIKE N'SELECT TOP%'
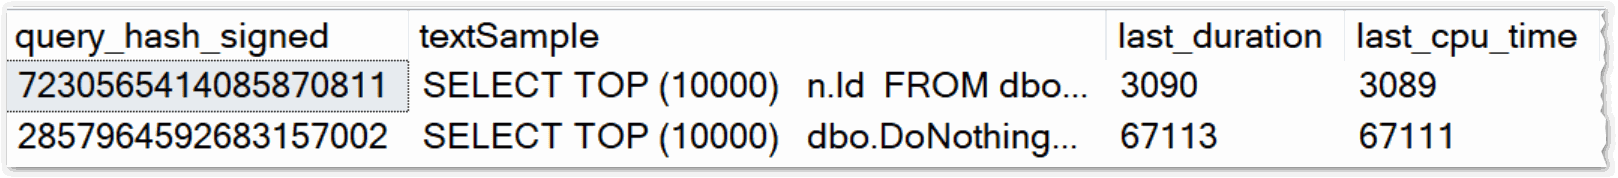
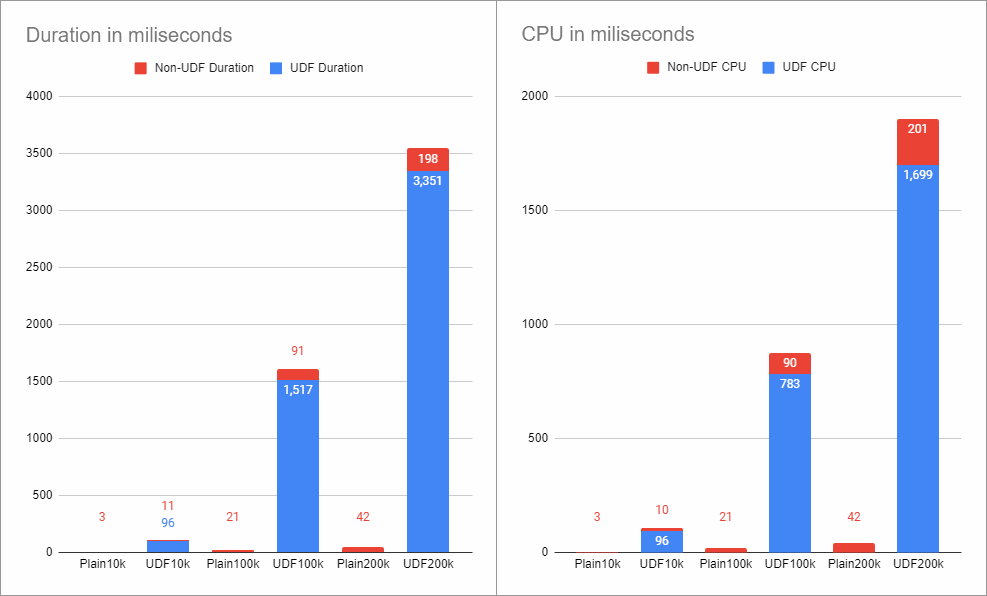
The duration and CPU time are in microseconds.
We can see that the Scalar function that does nothing is over 20 times worse than its counterpart.
Extended Events
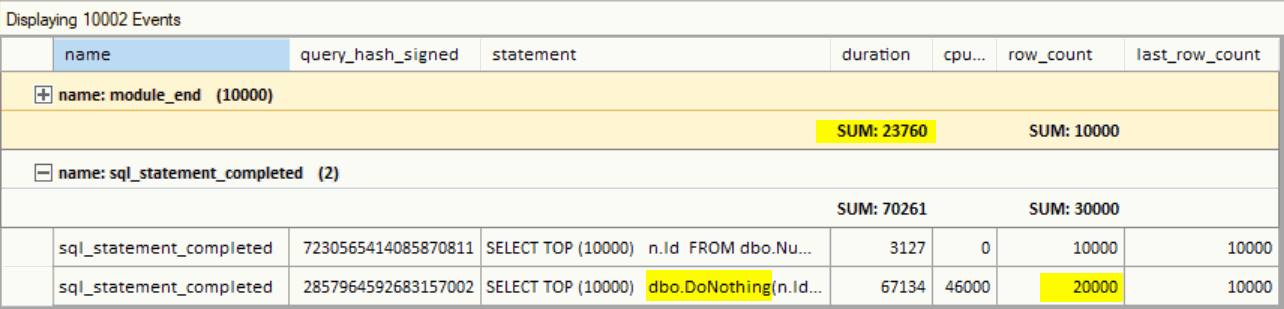
I've grouped the output by event name and aggregated the duration. The module_end event is fired for each execution of the Scalar function. That means for every row (10k). It doesn't collect the CPU time.
The data is very similar to Query Store's (I've collected it from separate runs). First, though, I'd like to point out some interesting info.
- The row_count column for the query with the UDF shows double the values. I'm assuming it's for each row returned by both the query and the function.
- Also, the aggregated duration of the function calls is only 23 760, while the query duration is 67 134. That looks like the overhead of the UDF execution was more significant than its duration.
SET STATISTICS IO, TIME ON
We can see the difference here as well.
Actual execution plan
The actual execution plan also shows the UDF duration in the newer schemas (starting with the sql2019 xml schema).
Shows time statistics for single query execution.
CpuTime: CPU time in milliseconds
ElapsedTime: elapsed time in milliseconds
UdfCpuTime: Cpu time of UDF in milliseconds
UdfElapsedTime: Elapsed time of UDF in milliseconds
<QueryTimeStats CpuTime="21" ElapsedTime="51" UdfCpuTime="16" UdfElapsedTime="16" />
Plan explorer
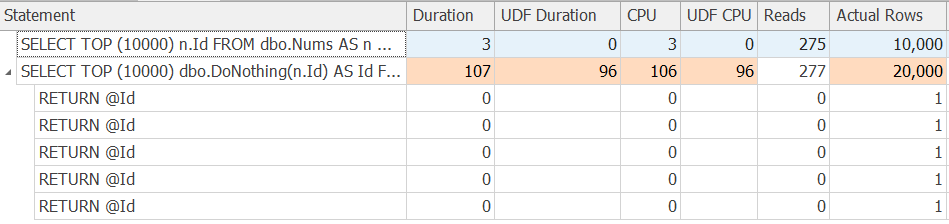
I like how the tool highlights the UDF problem so you can see it straight away. However, one double-edged sword is that it also tries to collect the execution plans (or at least sample) of the UDFs.
I've run into situations where my UDFs had multiple statements and ran over many rows, so the Plan Explorer collection couldn't keep up or ran out of memory.
But when it does, it gives you great insights, like these UDF warnings:

I've re-run the tests for different row counts, and the differences are staggering.
DoLookup in a Select statement
I'll create a new function that actually does something for a change.
Let's prepare some supporting tables first.
CREATE TABLE dbo.LookupTable
(
    Id int NOT NULL PRIMARY KEY
    , LookupValue varchar(50) NOT NULL
    , Filler char(100) NOT NULL
)

INSERT INTO dbo.LookupTable WITH (TABLOCK)
(Id, LookupValue, Filler)
SELECT TOP (26)
    n.Id, CHAR(64 + n.Id), ''
FROM dbo.Nums AS n
ORDER BY n.Id
It's a dummy lookup table for the test.
What's important is that a seek against this table uses 2 logical reads.
And that's what we'll do in the Scalar function:
CREATE OR ALTER FUNCTION dbo.DoLookup(@Id int)
RETURNS varchar(50)
AS
BEGIN
    DECLARE @ReturnId varchar(50)
    SET @ReturnId =
    (
        SELECT
            lt.LookupValue
        FROM dbo.LookupTable AS lt
        WHERE lt.Id = @Id
    )

    RETURN @ReturnId
END
For the performance test, I'll use these queries.
SELECT TOP (10000)
    n.Id
    , lt.LookupValue
FROM dbo.Nums AS n
LEFT JOIN dbo.LookupTable AS lt
    ON n.Id % 27 = lt.Id
ORDER BY n.Id
OPTION (MAXDOP 1)
GO
SELECT TOP (10000)
    n.Id
    , dbo.DoLookup(n.Id % 27)
FROM dbo.Nums AS n
ORDER BY n.Id
OPTION (MAXDOP 1)
JOIN on a calculation with a modulo % operator, but I didn't want to introduce a more complex table or change the one from Part 1. It won't affect the testing.
Hidden reads
Let's check first with the SET STATISTICS IO, TIME ON.
The first query has extra 20k reads against a LookupTable, but a duration of only 11 ms.
The second query shows only the 275 reads from the Nums table.
Nowhere does it show the LookupTable, and that's why the duration of 401 ms seems inexplicably high.
We must use the Query Store, XE or Plan Explorer to see those reads.
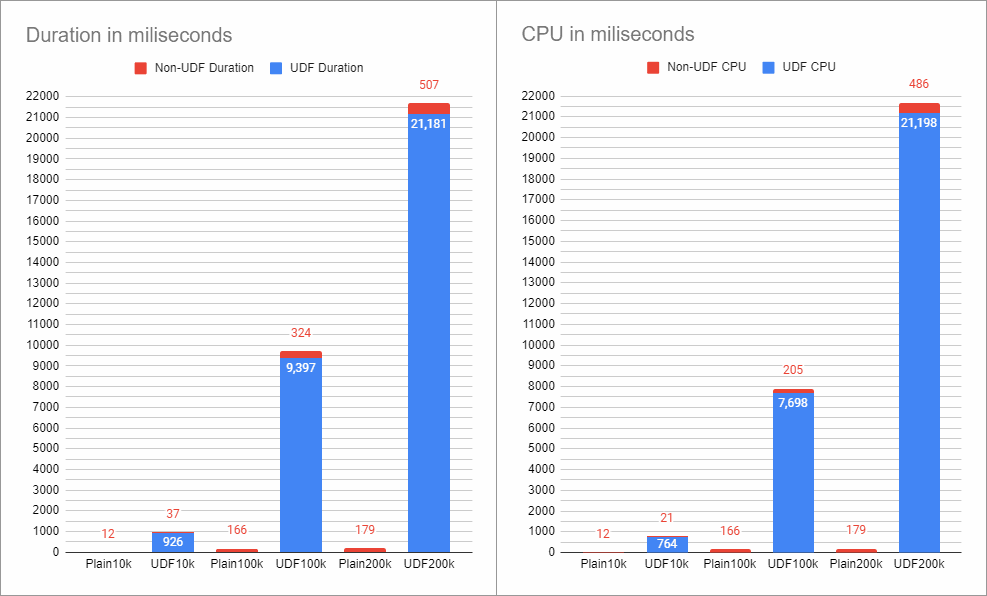
Query Store

Plan Explorer

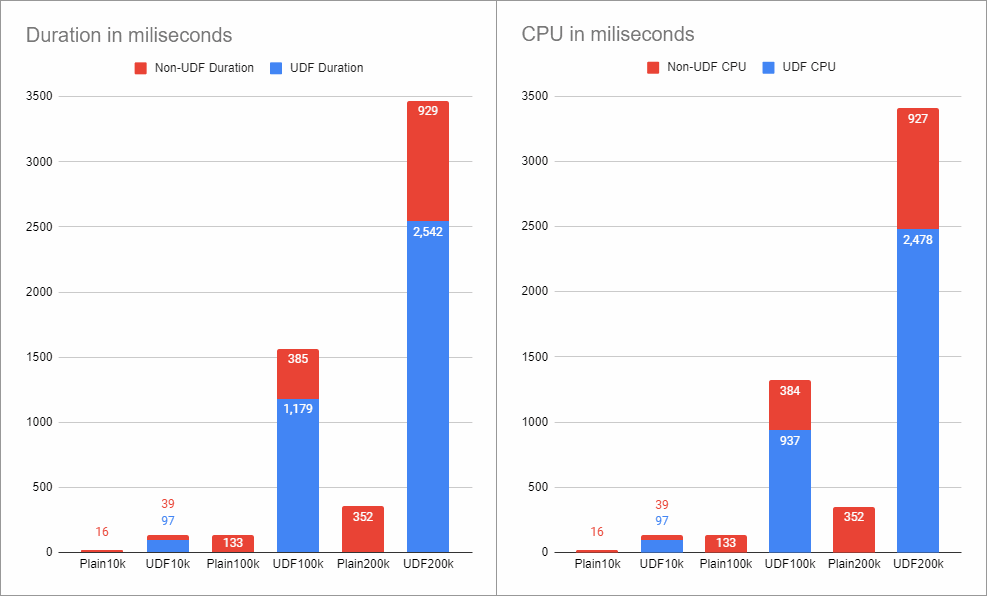
The performance gap grows even further when the Scalar function repeats work for each row.
DoNothing in a Check constraint
I'll create two tables that I TRUNCATE between the test runs.
CREATE TABLE dbo.PositiveId
(
    Id int PRIMARY KEY
    , CONSTRAINT CK_PositiveId CHECK (Id > 0)
)
GO
CREATE TABLE dbo.PositiveIdScalar
(
    Id int PRIMARY KEY
    , CONSTRAINT CK_PositiveIdScalar CHECK (dbo.DoNothing(Id) > 0)
)
The test query
INSERT INTO dbo.PositiveId (Id)
SELECT TOP (10000)
    n.Id
FROM dbo.Nums AS n
ORDER BY n.Id
GO
INSERT INTO dbo.PositiveIdScalar (Id)
SELECT TOP (10000)
    n.Id
FROM dbo.Nums AS n
ORDER BY n.Id
The actual plans reveal the difference. The scalar version carries a warning on the INSERT operator and a costlier Assert:
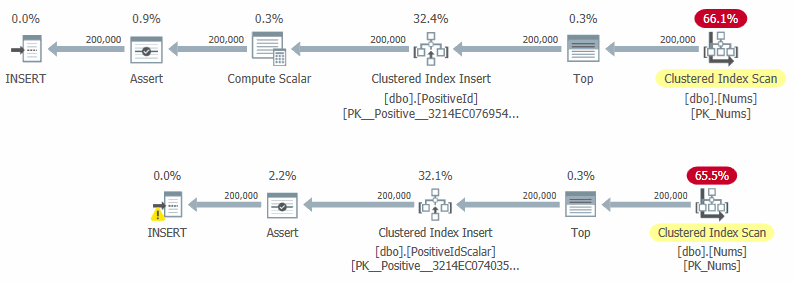
And the timings confirm it:
DoNothing in a Computed column
Unless the Computed column is persisted (not a default behaviour), there is no change in performance.
That's because only a definition is saved, not the actual value. Persisting a Computed column requires a deterministic function, so I'll create a new version with a slight variation.
Otherwise, we would get this error:
CREATE OR ALTER FUNCTION dbo.DoNothingDeterministic(@Id int)
RETURNS int
WITH SCHEMABINDING -- enables determinism
AS
BEGIN
    RETURN @Id
END
GO
Now we can create the tables
CREATE TABLE IdCalculation
(
    Id int PRIMARY KEY
    , IdCalculation AS Id
)
GO
CREATE TABLE IdCalculationScalarPersisted
(
    Id int PRIMARY KEY
    , IdCalculation AS dbo.DoNothingDeterministic(Id) PERSISTED
)
And the testing queries
INSERT INTO dbo.IdCalculation (Id)
SELECT TOP (10000)
    n.Id
FROM dbo.Nums AS n
ORDER BY n.Id
GO
INSERT INTO dbo.IdCalculationScalarPersisted (Id)
SELECT TOP (10000)
    n.Id
FROM dbo.Nums AS n
ORDER BY n.Id
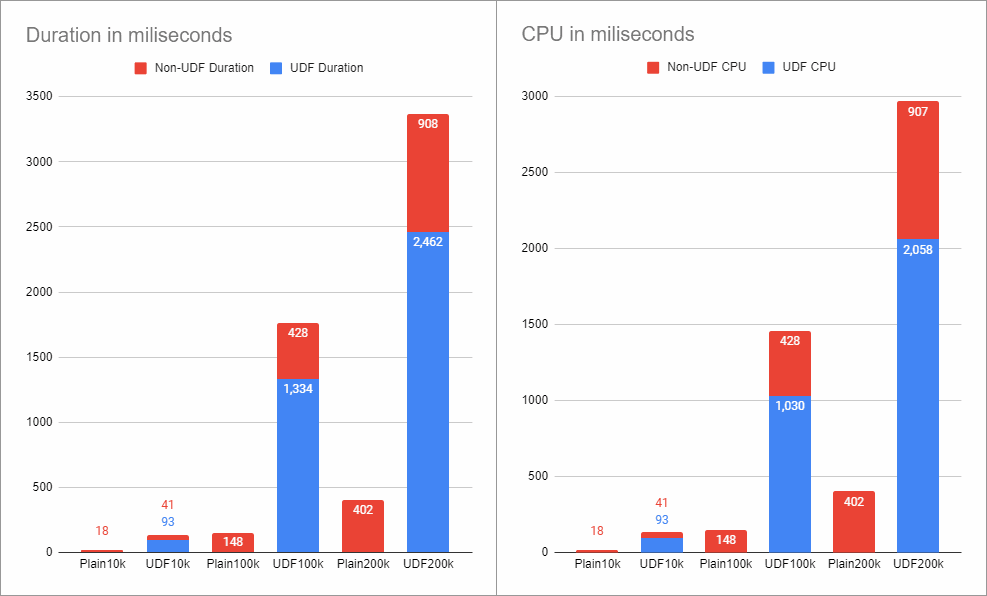
And finally, the performance results.
Recap
The performance of Scalar functions is horrendous even when it does nothing.
It worsens when the UDF has multiple statements, more complex logic, reads, etc.
Furthermore, I consider that Scalar UDFs must be destroyed. Scalar UDF delenda est.
The next article in the series will be about methods to solve the problems related to Scalar functions.
Thank you for reading