
Foreword
In the previous posts, we covered why Scalar UDFs are bad for parallelism and performance, and what the options are for their removal.
That leaves one question: where do you start? There's no single right answer, so instead I offer several strategies you can mix and match.
Optimize your workload regardless of Scalar functions
Open your favourite monitoring tool (mine is Query Store) and find the Top CPU consuming queries in your workload. Optimize as usual, but if you run across a UDF, you probably have an easy win right there.
UDFs in table and view definitions
That means Check constraints and Computed columns.
While these might be harder to replace (sometimes you have to move the logic elsewhere), these will have a significant impact. Because Scalar UDFs are parallelism inhibitors for anything that touches those tables, there is a good chance you want that parallelism enabled.
UDFs in triggers
Similar logic. You'll be paying the UDF tax if your table sees any activity that fires the triggers. I would start with the most frequently accessed tables.
Easy to rewrite UDFs
Maybe you need some quick and easy wins to get people on board with the idea of getting rid of the UDFs. Easy to rewrite can mean several things:
- Not referenced in many objects - so they are easy to replace with fewer deployments.
- Easily testable. Maybe it has only a few parameters or not many code paths.
- Easy to convert to an ITVF. It might already only have one statement, and the only change you need is to replace
RETURNS [data_type]withRETURNS TABLE.
A code snippet later in this post helps with finding UDFs with the lowest number of references.
Top resource-consuming UDFs
A DMV sys.dm_exec_function_stats tracks the aggregated statistics of cached functions. That means a server restart or other activity clears the cache and affects it. Nonetheless, it's where you can find the worst UDF performance offenders across the whole instance.
Snippets
Now that we've covered the strategies, here are a few useful snippets.
Finding the references
DROP TABLE IF EXISTS #UdfReferences
CREATE TABLE #UdfReferences
(
    dbName         nvarchar(128),
    refingObjId    int,
    refingObjType  nvarchar(60),
    refingSchName  nvarchar(128),
    refingObjName  nvarchar(128),
    refingColName  nvarchar(128),
    fnObjId        int,
    fnSchName      nvarchar(128),
    fnName         nvarchar(128),
    is_inlineable  bit,
    inliningStatus varchar(3)
)

INSERT INTO #UdfReferences
(
    dbName,
    refingObjId,
    refingObjType,
    refingSchName,
    refingObjName,
    refingColName,
    fnObjId,
    fnSchName,
    fnName,
    is_inlineable,
    inliningStatus
)
SELECT
    DB_NAME() AS dbName
    , ro.object_id AS refingObjId
    , ro.type_desc AS refingObjType
    , SCHEMA_NAME(ro.schema_id) AS refingSchName
    , CONCAT
    (
        OBJECT_NAME(ro.parent_object_id) + N'_'
        , ro.name
    ) AS refingObjName /* if constraint, CONCAT with the parent table name */
    , COALESCE(cc.name, chkConstraint.colName, dfConstraint.colName) AS refingColName
    , fno.object_id AS fnObjId
    , fns.name AS fnSchName
    , fno.name AS fnName
    , sm.is_inlineable
    , IIF(sm.inline_type = 0, 'OFF', 'ON') AS inliningStatus
FROM sys.sql_expression_dependencies AS sed
JOIN sys.objects AS ro
    ON ro.object_id = sed.referencing_id
LEFT JOIN
(
    SELECT
        cc.object_id
        , c.name AS colName
    FROM sys.check_constraints AS cc
    JOIN sys.columns AS c
        ON cc.parent_object_id = c.object_id
        AND cc.parent_column_id = c.column_id
) chkConstraint
    ON chkConstraint.object_id = ro.object_id
LEFT JOIN
(
    SELECT
        dc.object_id
        , c.name AS colName
    FROM sys.default_constraints AS dc
    JOIN sys.columns AS c
        ON dc.parent_object_id = c.object_id
        AND dc.parent_column_id = c.column_id
) dfConstraint
    ON dfConstraint.object_id = ro.object_id
LEFT JOIN sys.columns AS cc /* computed column */
    ON sed.referencing_id = cc.object_id
    AND sed.referencing_minor_id = cc.column_id
JOIN sys.objects AS fno
    ON fno.name = sed.referenced_entity_name
    AND fno.type = 'FN'
JOIN sys.schemas AS fns
    ON fns.schema_id = fno.schema_id
    AND fns.name = sed.referenced_schema_name
JOIN sys.sql_modules AS sm
    ON sm.object_id = fno.object_id

SELECT
    *
FROM #UdfReferences AS ur
WHERE
    ur.refingColName IS NOT NULL
    OR ur.refingObjType IN
    (
        N'VIEW'
        , N'SQL_TRIGGER'
    )
ORDER BY ur.refingObjType

SELECT
    ur.fnObjId
    , ur.fnSchName
    , ur.fnName
    , ur.is_inlineable
    , ur.inliningStatus
    , COUNT(1) AS objRefCount
    , STRING_AGG
    (
        CONCAT(CAST(N'' AS nvarchar(MAX)), ur.refingSchName,N'.',ur.refingObjName)
        , CHAR(13) + CHAR(10)
    ) AS aggregatedReferencingObjects
FROM #UdfReferences AS ur
GROUP BY
    ur.fnObjId
    , ur.fnSchName
    , ur.fnName
    , ur.is_inlineable
    , ur.inliningStatus
ORDER BY objRefCount DESC
The first result set shows the UDFs in a Table definition, Trigger or View.
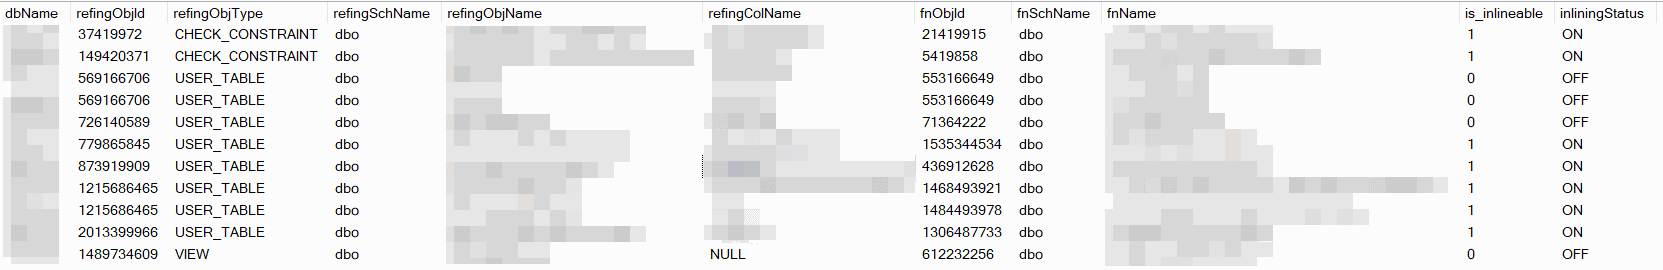
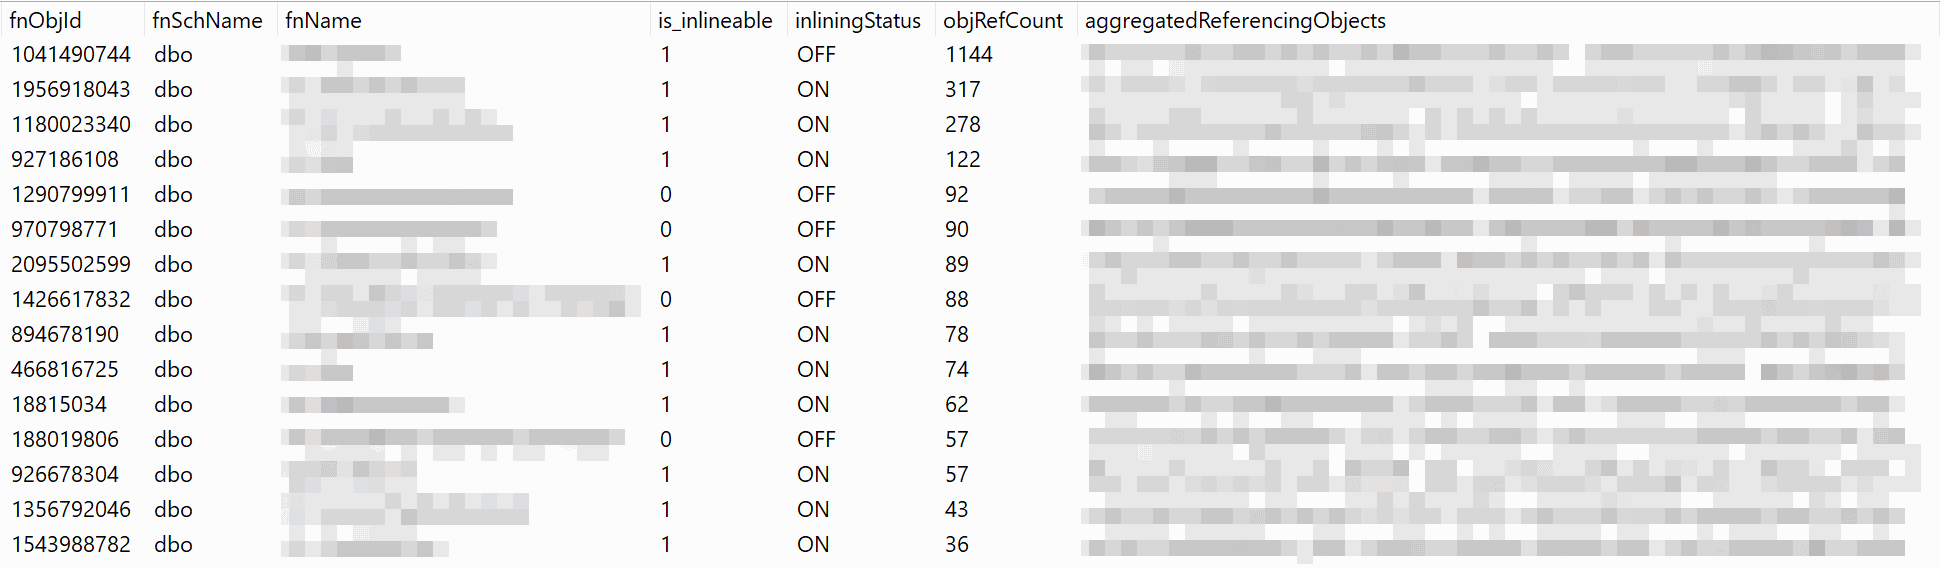
The second result set shows how many times and which objects reference the UDF (and how hard it will be to replace across the board).
Finding the performance stats of Scalar UDFs
; -- Previous statement must be properly terminated
WITH detailPerPlan AS
(
    SELECT
        defs.database_id,
        defs.object_id,
        defs.total_worker_time,
        defs.execution_count,
        defs.total_elapsed_time,
        defs.total_elapsed_time / defs.execution_count AS avg_elapsed_time,
        defs.last_elapsed_time,
        defs.last_execution_time,
        defs.cached_time
        , ca.cachedSeconds
        , ca2.total_worker_time_s
        , ca2.total_elapsed_time_s
        , ca2.total_worker_time_s / ca.cachedSeconds AS WorkerTimeSecPerSecondsCached
        , ca2.total_elapsed_time_s / ca.cachedSeconds AS ElapsedTimeSecPerSecondsCached
        , defs.execution_count / ca.cachedSeconds AS ExecutionsPerSecondsCached
    FROM sys.dm_exec_function_stats AS defs WITH (NOLOCK)
    CROSS APPLY
    (
        VALUES (CAST(DATEDIFF(SECOND, defs.cached_time, GETDATE()) AS decimal(15,5)))
    ) AS ca(cachedSeconds)
    CROSS APPLY
    (
        VALUES
        (
            defs.total_worker_time / POWER(10.,6)
            , defs.total_elapsed_time / POWER(10.,6)
        )
    ) AS ca2 (total_worker_time_s, total_elapsed_time_s)
)
, groupedDatabaseObject
AS
(
    SELECT
        dpp.database_id
        , dpp.object_id
        , SUM(dpp.execution_count) AS execution_count_sum
        , SUM(dpp.total_worker_time) AS total_worker_time_sum
        , CAST(SUM(dpp.total_worker_time) / ((SUM(dpp.execution_count)) * 1.) AS decimal(20,2)) AS avg_worker_time_sum
        , SUM(dpp.total_elapsed_time) AS total_elapsed_time_sum
        , CAST(SUM(dpp.total_elapsed_time) / ((SUM(dpp.execution_count)) * 1.) AS decimal(20,2)) AS avg_elapsed_time_sum
        , CAST(SUM(dpp.total_worker_time_s) / SUM (dpp.cachedSeconds) AS decimal(20,2)) AS WorkerTimeSecPerSecondsCached_Sum
        , CAST(SUM(dpp.total_elapsed_time_s) / SUM (dpp.cachedSeconds) AS decimal(20,2)) AS ElapsedTimeSecPerSecondsCached_Sum
        , CAST(SUM(dpp.execution_count) / SUM (dpp.cachedSeconds) AS decimal(20,2)) AS ExecutionsPerSecondsCached_Sum
    FROM detailPerPlan AS dpp
    GROUP BY
        dpp.database_id
        , dpp.object_id
)
SELECT
    CASE gdo.database_id
        WHEN 32767 /* https://learn.microsoft.com/en-us/sql/relational-databases/databases/resource-database?view=sql-server-ver16 */
        THEN N'Resource database (Hidden)'
    ELSE
        DB_NAME (gdo.database_id)
    END AS [Database Name],
    CASE gdo.database_id
        WHEN 32767
        THEN OBJECT_NAME (gdo.object_id)
    ELSE
        OBJECT_NAME (gdo.object_id, gdo.database_id)
    END AS [Function Name]
    , gdo.*
FROM groupedDatabaseObject AS gdo
ORDER BY WorkerTimeSecPerSecondsCached_Sum DESC
The result could look like this. It was taken from an instance with quite a few active Scalar Functions.

All the values are in microseconds (unless specified otherwise). Because different plans might be in cache for various periods, the default ordering is by worker time (CPU) in seconds per second cached. But it has many dimensions, so you can order it any way you want it (if that's the way you need it).
Recap
We've covered several techniques to triage and pick Scalar UDF candidates for a rewrite. However, the call to action from the last post still applies - provide me with an example of a Scalar UDF, and I'll post a tutorial on how to rewrite it to ITVF.
Otherwise, this post concludes the series. I hope you found it helpful.
Thank you for reading