
The people of Digitown are being targeted by phishermen, and they need my help to stop them in their tracks.
The problem
The police have asked for our assistance, and we've got a massive data set to work with. We've got listings of all the calls that have been made during the week, and we need to find the source of the phishing calls.
It's not going to be easy, but we know you're up for the challenge! We need you to analyze the data and use your detective skills to find any patterns or clues that could lead us to the source of these calls.
And the main question is:
What phone number is used for placing the phishing calls?
Let's take a look at our new table PhoneCalls
PhoneCalls
| take 50
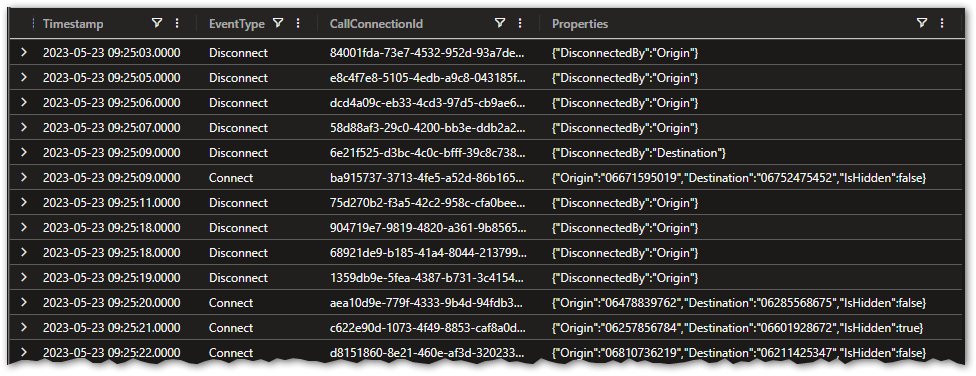
The data spans a single week - May 21 through May 27, 2023.
Looking at the data I can infer a couple of things:
- There are two EventTypes -
ConnectandDisconnect Connecthas the information about origin and destination as well as if it's hiddenDisconnecthas info about who ended the call- The time between
ConnectandDisconnecttimestamps will also serve as the call duration
So right off the bat I know I'll have to do parsing of the dynamic Properties column as well as self-join on the CallConnectionId.
Modus operandi
Let's also make a few assumptions about the phisher:
- They will make a lot of calls to unique numbers
- They'll prefer to hide their caller ID
- The calls will generally be short - either they succeed or give up on the target
- Most of the time the call will be ended by the potential victim
Let's look at how call durations are distributed. I'm bucketing them into 5-minute bins.
// 5 minute bucket histogram
PhoneCalls
| where Timestamp >= datetime(2023-05-21) and Timestamp < datetime(2023-05-28)
| where EventType == "Connect"
| extend
    tostring(Properties.Origin)
    , tostring(Properties.Destination)
    , tobool(Properties.IsHidden)
| project-rename ConnectTime = Timestamp
| join kind=inner
(
    PhoneCalls
    | where Timestamp >= datetime(2023-05-21) and Timestamp < datetime(2023-05-28)
    | where EventType == "Disconnect"
    | extend tostring(Properties.DisconnectedBy)
    | project-rename DisconnectTime = Timestamp
) on CallConnectionId
| extend Duration = DisconnectTime - ConnectTime
| where Properties_DisconnectedBy == "Destination"
| summarize count() by bin(Duration, 5m)
| order by Duration asc
| render linechart
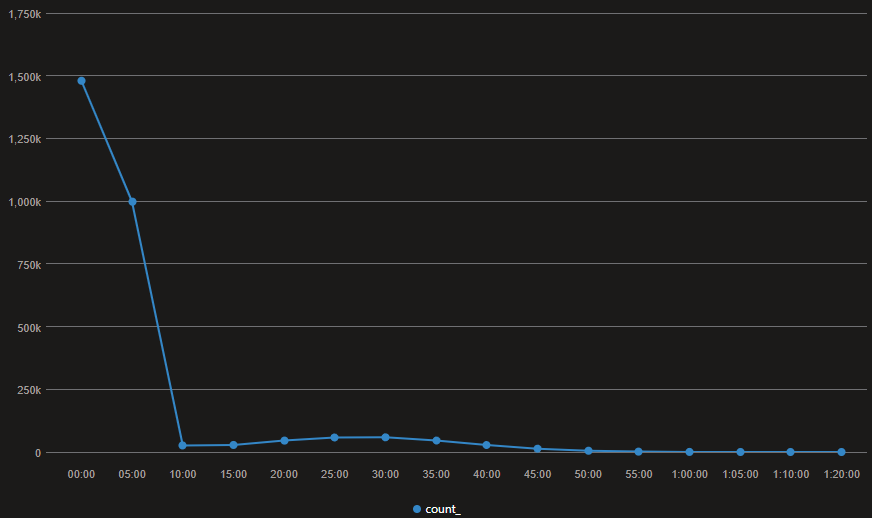
It looks like the vast majority of calls end before the ten-minute mark.
The histogram backs up the third assumption: most victim-disconnected calls finish inside ten minutes. Layer on hidden caller ID and the disconnect-by-destination filter, and the conditions are set.
The solution
PhoneCalls
| where Timestamp >= datetime(2023-05-21) and Timestamp < datetime(2023-05-28)
| where EventType == "Connect"
| extend
    tostring(Properties.Origin)
    , tostring(Properties.Destination)
    , tobool(Properties.IsHidden)
| project-rename ConnectTime = Timestamp
| where Properties_IsHidden
| join kind=inner
(
    PhoneCalls
    | where Timestamp >= datetime(2023-05-21) and Timestamp < datetime(2023-05-28)
    | where EventType == "Disconnect"
    | extend tostring(Properties.DisconnectedBy)
    | project-rename DisconnectTime = Timestamp
) on CallConnectionId
| extend Duration = DisconnectTime - ConnectTime
| where Properties_DisconnectedBy == "Destination"
| where Duration < 10m
| summarize
    count()
    , count_distinct(Properties_Destination)
    , avg(Duration)
    by Properties_Origin
| top 10 by count_ desc
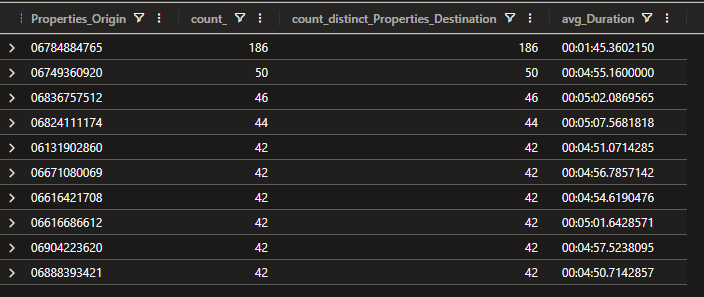
The first entry is miles ahead of the others - 186 calls to 186 distinct destinations, average under two minutes. The self-join paired origin details with duration and disconnect behaviour; the assumptions told it where to look. Another badge earned.
Thank you for reading