
Someone hacked into Digitown's municipality, stole classified documents, and vanished. All we have is 30 days of router logs and a lookup table. Time to find a needle in 45 million rows of hay.
The problem
This is the abridged case description. Emphasis mine:
I suspect that someone has hacked into the Digitown municipality system and stolen documents. Our system is a known data hub and hosts various information about the town itself, real-time monitoring systems of the city, tax payments, etc. It serves as a real-time data provider to many organizations around the world, so it receives a lot of traffic.
Unfortunately, I don't have much data to give you. All I have is a 30-day traffic statistics report captured by the Digitown municipality system network routers.
And the main question:
Who is behind all this?
We also get a few hints: the attack was well-prepared, the exfiltration would show as a sudden data burst, and the attacker likely used multiple IPs from the same network.
The investigation
What are we working with?
We get two tables: NetworkMetrics and IpInfo.
NetworkMetrics
| take 10
IpInfo
| take 10
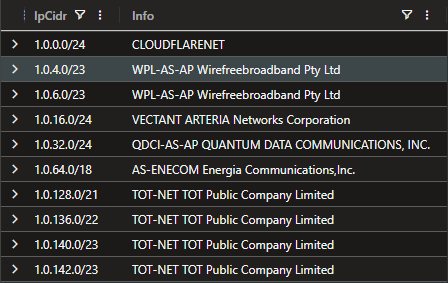
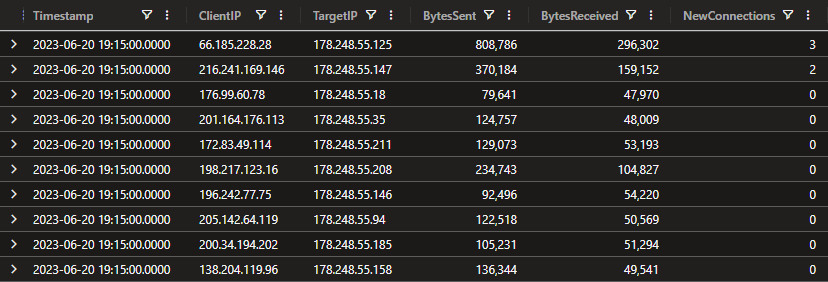
NetworkMetrics has per-minute traffic records: a client IP talking to a target IP, with bytes sent, bytes received, and new connections. IpInfo maps IP address ranges to company names via CIDR notation - 10.0.1.0/24 covers IPs 10.0.1.0 through 10.0.1.255. KQL's ipv4_lookup handles the matching.
Before touching the data, let's understand its shape:
NetworkMetrics
| summarize
    MinTime = min(Timestamp),
    MaxTime = max(Timestamp),
    DistinctClients = dcount(ClientIP),
    DistinctTargets = dcount(TargetIP),
    TotalRows = count()

A full month, ~10,000 external clients, just 254 targets - all in the 178.248.55.0/24 block (Digitown's own network). BytesSent is data leaving Digitown toward the client. Stolen documents = outbound spike.
BytesSent = data leaving Digitown (outbound). BytesReceived = requests coming in. We're hunting for stolen documents, so we want BytesSent.
Anomaly detection
Total volume won't help. A smart attacker doesn't top the leaderboard - they hide in the noise. What we need is whose pattern changed the most. A steady company that suddenly spikes is far more suspicious than a consistently heavy sender.
KQL's series_decompose_anomalies does exactly this:
- Decomposes a time series into baseline + seasonal pattern
- Scores each point by how many standard deviations it deviates from expected
- Anything beyond the threshold gets flagged as anomalous
The plan:
- Map client IPs to companies (
ipv4_lookup) - Build daily
BytesSentseries per company (make-series) - Score anomalies, rank by highest spike
Performance note: ipv4_lookup is a range-match - each IP checked against 656K CIDRs. Naively, we'd run it on ~300K rows (10K clients x 30 days), but the same IP repeats every day. Resolve each IP once via distinct, then enrich with lookup.
lookup instead of join? lookup is optimized for when the right side is smaller than the left. No shuffle overhead.
let IpMapping =
    NetworkMetrics
    | distinct ClientIP
    | evaluate ipv4_lookup(IpInfo, ClientIP, IpCidr)
    | project ClientIP, Company = Info;
let _step = 1d;
NetworkMetrics
| summarize BytesSent = sum(BytesSent) by ClientIP, bin(Timestamp, _step)
| lookup IpMapping on ClientIP
| summarize BytesSent = sum(BytesSent) by Company, Timestamp
| make-series Metric = sum(BytesSent) on Timestamp step _step by Company
| extend Metric = series_fill_backward(series_fill_forward(Metric))
// 3.0 = flag anything beyond 3 standard deviations
| extend (flag, score, base) = series_decompose_anomalies(Metric, 3.0)
| mv-apply
    OneFlag = flag to typeof(bool),
    OneScore = score to typeof(real)
    on (
        where OneFlag == 1
        | top 1 by OneScore desc
    )
| top 5 by OneScore desc
| project Company, AnomalyScore = round(OneScore, 1)
Key lines:
Company = Info-ipv4_lookupbrings in theInfocolumn fromIpInfo. We alias it so the output is self-explanatory.distinct+lookup- 10K range lookups instead of 300K. About 2.5x faster, 18x less memory.series_fill_forward/fill_backward-make-seriesproduces nulls for zero-traffic days. Anomaly detection can't handle nulls, so we fill gaps.mv-apply- unpacks each company's score array, keeps only flagged points, returns the peak score.
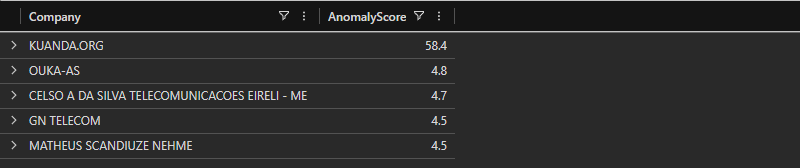
KUANDA.ORG leads by an order of magnitude. Everyone else clusters near the baseline. Not even close.
The solution
KUANDA.ORG is behind the breach.
If you don't need per-day flag inspection, series_stats_dynamic is a simpler alternative to mv-apply:
| extend max_score = toreal(series_stats_dynamic(score)['max'])
| top 5 by max_score desc
Same result, less control over which days are flagged.
Another case closed, another badge earned.
Thank you for reading